(16) Efficiency In Traversing A Right-Angle Maze #2
Description
This section is from the book "Human Vitality And Efficiency Under Prolonged Restricted Diet", by Francis G.BENEDICT, Walter R. Miles, Paul Roth, And H. Monmouth Smith. Also available from Amazon: Human Vitality and Efficiency Under Prolonged Restricted Diet.
(16) Efficiency In Traversing A Right-Angle Maze #2
Two groups of individuals may conceivably show the same initial results in a test or measurement and later, upon repetition of the same task, may demonstrate different degrees of learning ability and rate of improvement. The ability to learn and the conditions which favor or oppose it are of great significance. The maze test was used in this study of the effect of food reduction on men to throw light on this question. It is evident that in repeatedly solving this problem according to directions (see p. 189) the subjects would naturally require shorter and shorter time intervals.
This test, with the same directions and conditions, was used in the normal series of 1917. A group of 67 normal college men, most of them upper classmen or recent college graduates, performed the task three times in succession. The men were carefully observed, and the time from beginning to successful completion of each trial accurately recorded. The classified results for the first two trials are given in table 186. At the initial trial one man did the task in 58 seconds; 23 of the group, that is 34 per cent, completed it in from 101 to 200 seconds; 5 required 600 seconds or more; 2 men failed entirely, giving it up after 18 and 33 minutes, respectively. In the second trial, which was begun about 15 seconds after the first trial was completed, 8 of the men did it in 50 seconds or less, and only one of the 651 who completed it required more than 600 seconds. The range in the first trial was from 58 to 1,150 seconds; for the second trial, it was from 35 to 637 seconds; the latter value is from the same individual whose first trial required the 1,150 seconds. The man who did best in the first trial had values for the three tests as follows: 58, 42, and 76 seconds. In the third trial he became careless and overconfident and lost speed. The individual who showed the best record in the second trial had values for the three trials as follows: 87, 35 and 19 seconds. Some of the other subjects showed very rapid performance with consistent improvement; for example, No. 1, with records of 76, 50, and 45 seconds; No. 45 with 85, 41, and 33 seconds; and No. 63, whose time was 77, 40, and 31 seconds. These records are of course exceptional. The score of 19 in the third trial is the shortest time in which any one has so far completed the task. The averages for the three trials in order for the whole group are: 264, 119, and 90 seconds.
Table 186. - Distribution Of Men In Normal Series Of 1917 According To Number Of Seconds Required To Complete The Maze Test
Ranges. | 50 or less. | 51 to 75. | 76 to 100. | 101 to 200. | 201 to 300. | 301 to 400. | 401 to 500. | 501 to 600. | 601 or more. |
First trial... | 0 | 1 | 11 | 23 | 12 | 7 | 3 | 3 | 5 |
Second trial.... | 8 | 15 | 17 | 18 | 3 | 2 | 1 | 0 | 1 |
1There was no second trial for the men who are noted as failing in the first. Of course literally these men tried many times, i. e., they made many fresh starts, but always got hopelessly lost through their failure to follow the directions carefully. The third trial followed the second trial after a short intermission, but for one reason or another six of the aviation candidates did not do the task a third time and these data have not been tabulated in table 186. The men in the low-diet research made only one trial to completion on each evening.
On each evening the subjects of the low-diet research traced completely through the maze but once and, with the exception of Mon, had no other practice. The first trial of our subjects is therefore comparable with that of the aviators.
Table 187. - Squad A - Efficiency In Performing The Maze Test
[Time in seconds].
Date. | Statement of score. | Bro. | Can. | Kon. | Gar. | Gul. | Mon.1 | Moy. | Pea.1 | Pec. | Spe. | Tom. | Vea. | Fre. | Av.3 |
1917. | |||||||||||||||
Sept. 29... | Time | 555 | 268 | 192 | 303 | 177 | 1800 + | 163 | 322 | 249 | 261 | 106 | 282 | 104 | 270 |
Starts | (4) | .. | .. | .. | .. | .. | .. | .. | .. | .. | |||||
Oct. 13... | Time | 83 | 316 | .. | 660 | 206 | 432 | 124 | 93 | 211 | 139 | 106 | 59 | 61 | 206 |
Starts | 1 | 1 | .. | 2 | 3 | 3 | 2 | 1 | 2 | 2 | 1 | 1 | 1 | 1.6 | |
Oct. 27... | Time | 96 | 211 | 154 | 1110 | 87 | 1000 + | 58 | 75 | 153 | 173 | 94 | 293 | .. | 242 |
Starts | 2 | 2 | 2 | 3 | 1 | 7 | 1 | 1 | 1 | 3 | 1 | 2 | .. | 1.6 | |
Nov. 10... | Time | 64 | 395 | 66 | 179 | 190 | 626 + | 37 | 88 | 169 | 98 | 65 | 89 | .. | 142 |
Starts | 1 | 2 | 1 | 1 | 2 | 5 | 1 | 1 | 2 | 2 | 1 | 1 | .. | 1.3 | |
Nov. 24... | Time | 61 | 174 | 121 | 104 | 60 | 667 + | 29 | 50 | 121 | 76 | 38 | 43 | .. | 75 |
Starts | 2 | 1 | 3 | 1 | 1 | 6 | 1 | 1 | 1 | 1 | 1 | 1 | .. | 1.1 | |
Dec. 8... | Time | 75 | 157 | 64 | 177 | 59 | 628 + | 26 | 34 | 106 | 68 | 97 | 237 | .. | 107 |
Starts | 2 | 1 | 1 | 2 | 1 | 7 | 1 | 1 | 1 | 1 | 2 | 3 | .. | 1.6 | |
Dec. 19.. . | Time | 66 | 141 | 74 | 77 | 44 | 525 + | 27 | 37 | 86 | .. | 113 | 25 | .. | 68 |
Starts | 2 | 1 | 2 | 1 | 1 | 3 | 1 | 1 | 1 | .. | 2 | 1 | .. | 1.2 | |
1918. | |||||||||||||||
Jan. 12... | Time | 30 | 136 | 41 | 73 | 57 | 640 + | 26 | 51 | 93 | .. | 37 | 56 | .. | 62 |
Starts | 1 | 1 | 2 | 1 | 1 | 5 | 1 | 1 | 1 | .. | 1 | 1 | .. | 1.0 | |
Jan. 26... | Time | 61 | 106 | 29 | 198 | 38 | 400 + | 26 | 39 | 89 | .. | 38 | 26 | .. | 69 |
Starts | 2 | 1 | 1 | 2 | 1 | 3 | 1 | 1 | 1 | .. | 1 | 1 | .. | 1.2 | |
Feb. 2... | Time | 53 | 267 | 26 | 56 | 29 | 220 + | 23 | 65 | 72 | .. | 29 | 30 | .. | 69 |
Starts | 1 | 3 | 1 | 1 | 1 | 3 | 1 | 2 | 1 | .. | 1 | 1 | .. | 1.3 | |
Low-diet av | Time | 65.4 | 211.4 | 71.9 | 292.7 | 85.6 | .. | 41.8 | 59.1 | 122.2 | 110.8 | 68.6 | 95.3 | 61 | 115.6 |
Starts | 1.6 | 1.4 | 1.6 | 1.6 | 1.3 | .. | 1.1 | 1.1 | 1.2 | 1.8 | 1.2 | 1.3 | .. | 1.4 | |
1Mon apparently developed a complex against this test; he never succeeded in completing the test at the appointed time. He did do it once or twice out of hours. His results are not included in the average. 2Pea was left-handed and the left hand was used in the tracing-box with right hand on top of box. 3The records of Mon, Kon, Spe, and Fre are not included in this average. 4No record kept of number of starts on first night.
In tables 187 and 188 the data are given for Squads A and B. Nine men of Squad A (omitting Kon, Mon, Spe, and Fre, for reasons given in the footnotes to table 187 and elsewhere in the text) show an average in their first performance (September 29) of 270 seconds. This compares remarkably well with the average of 264 seconds for the normal series of 1917. The range aside from Mon, who failed, is from 104 to 555 seconds. None of the men performed the test as quickly as did 12 of the aviators at their first attempt. (See table 186.) Squad B, table 188, in their first trial had approximately the same range as Squad A, that is, from 128 to 526 seconds. One man, How, after 1,410 seconds, was unable to complete the test and there was no time for further trial. The average for the initial test of Squad B on October 6, excluding How, who did not succeed, and Mac,1 is 208 seconds, that is, somewhat lower than what would normally be expected.
Table 188. - Squad B - Efficiency In Performing The Maze Test
[Time in seconds).
Data. | Statement of score. | Fis. | Har. | How. | Ham. | McM. | Kim. | Lon. | Mac. | Sch. | Liv. | Sne. | Tho. | Van. | Wil. | Av.1 |
1917. | ||||||||||||||||
Oct. 6 | Time | 204 | 134 | 21410+ | 450 | .. | .. | 128 | 252 | .. | 165 | 131 | 180 | 526 | 157 | 208 |
Starts | (3) | .. | .. | .. | .. | .. | .. | .. | .. | .. | .. | .. | .. | .. | .. | |
Nov. 3 | Time | 272 | 99 | 770 | 191 | 976 | .. | 359 | 753 | .. | 211 | 143 | 645 | 130 | 269 | 309 |
Starts | 2 | 1 | 7 | 2 | 10 | .. | 3 | 4 | .. | 2 | 1 | 4 | 1 | 3 | 2.6 | |
Nov.17 | Time | 200 | 244 | 248 | 288 | 380 | .. | 106 | 500 | .. | 66 | 81 | 207 | 189 | 264 | 189 |
Starts | 1 | 2 | 2 | 3 | 3 | .. | 1 | 3 | .. | 1 | 1 | 1 | 1 | 3 | 1.6 | |
Dae. 15 | Time | .. | 182 | 397 | 141 | 488 | .. | 197 | 280 | .. | 46 | 71 | 92 | 185 | 68 | 153 |
Starts | .. | 1 | 6 | 2 | 5 | .. | 2 | 1 | .. | 1 | 1 | 1 | 1 | 1 | 1.7 | |
Jan. 6 | Time | 87 | 61 | 119 | 49 | 220 | .. | 590 | 60 | 116 | 93 | 88 | 61 | 80 | ||
Starts | 1 | 1 | 2 | 1 | 3 | .. | 4 | 1 | 2 | 1 | 1 | 1 | 1.2 | |||
Normal av... | Time | 191 | 142 | 384 | 224 | 516 | .. | 198 | 446 | 594 | 110 | 108 | 243 | 224 | 164 | 188 |
Starts | 1.3 | 1.3 | 4.0 | 2.0 | 5.3 | 2.0 | 2.7 | 4 | 1.3 | 1.3 | 1.8 | 1 | 2 | 1.8 | ||
Jan. 13 | Time | 103 | 42 | 43 | 217 | . | 374 | 70 | .. | 164 | 77 | 56 | 66 | 69 | 51 | 79 |
Starts | 1 | 1 | 1 | 3 | ... | 3 | 1 | .. | 1 | 1 | 1 | 1 | 1 | 1 | 1.2 | |
Jan. 19 | Time | 71 | 41 | 61 | 44 | .. | 75 | 37 | .. | 200 | 37 | 50 | 58 | 281 | 47 | 73 |
Starts | 1 | 1 | 1 | 1 | .. | 1 | 1 | .. | 1 | 1 | 1 | 1 | 4 | 1 | 1.3 | |
Jan. 27 | Time | 61 | 39 | 51 | 41 | .. | 46 | 40 | .. | 163 | 29 | 50 | 50 | 105 | 36 | 50 |
Starts | 1 | 1 | 1 | 1 | .. | 1 | 1 | .. | 1 | 1 | 1 | 1 | 2 | 1 | 1.1 | |
Low-diet av. | Time | 78 | 41 | 52 | 101 | ... | 165 | 49 | ... | 176 | 48 | 52 | 58 | 152 | 45 | 67 |
Starts | 1 | 1 | 1 | 1.7 | .. | 1.7 | 1 | . | 1 | 1 | 1 | 1 | 2.3 | 1 | 1.2 | |
1 These averages do not include McM, Kim, Mac, and Sch.
2 Not in the average.
3 Number of starts not recorded on first day.
It is unnecessary to discuss the individual values. Aside from some irregularities nearly all the subjects show a rather consistent reduction in time required for the task from experiment to experiment. In the nature of the case, it could not be expected that the normal average and the low-diet average of Squad B would be directly comparable. The average values for both squads are plotted in figure 122. It is noteworthy that the two curves are nearly at the same level and follow the same general course; they may reasonably be regarded as normal practice curves. Squad B was somewhat handicapped by the longer interval between their first and second experiments, that is, from October 6 to November 3, and there is a marked decline on the latter date. Inspection of table 188 will show that 7 of the men increased the time for performing the task. They seem to have approached the problem in an overconfident attitude, and not to have paid careful attention to the directions. Five of these men who required a longer time at the second trial became confused; these subjects had to make three or four beginnings before they completed the task.1 Another cause for the depression in the curve of Squad B on November 3 is that on this date How was included, but he was not included in the average for October 6 as he failed to complete the task. His score for November 3 is largest of all, being 770 seconds. Beyond this point, Squad B continued to improve and reached a level on January 5, from which they improved very slowly on the three food-reduction dates.
1 The latter is excluded because his records are not complete for the food reduction period.
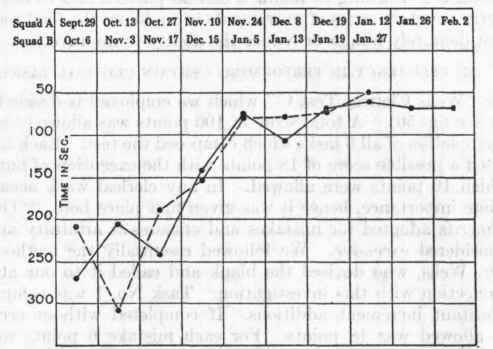
Fig. 122. - Average time required to complete the maze-tracing task. Solid lines represent Squad A, broken lines Squad B.
The curve for Squad A is depressed on October 27. This is not shown by the individual performance of all the group, but appears to be due largely to the poor and irregular performance of Gar and Vea; the former became confused twice and was obliged to begin again, with the result that the time required (1,110 seconds) is the longest in table 187 for the 9 men whose records are averaged. There is also a depression in the curve on December 8. This was also due to the irregular work of Vea and Gar, and to some extent of Tom. The averages for the last four dates of Squad A show an even level of about 70 seconds, approximately the same as that for Squad B and somewhat less than the average for the third trial of the normal series of 1917, i. e., 90 seconds.1 It is of course impossible to predict what the result with the group of 67 men would have been had they taken the test the same number of times in experiments separated by the same time intervals as those for Squads A and B, but considering the fact that the two squads show results which are comparable and which in the initial trials compare favorably with those for the larger group of 1917, and furthermore, considering that the two squads show practice of about the same rate and finally reach the same level, it seems reasonable to conclude that in this task of learning to follow a certain pattern and to coordinate correctly a certain series of movements in so doing, the food reduction did not definitely hinder or reduce the ability to improve.
1No record was kept of the number of beginnings required on the first evening. This record for later experiments is included in the table, as it illuminates the time record, indicating in the case of a long time whether they moved very slowly and carefully or carelessly.
Continue to:
My Books

