Transition Pulse. Part 2
Description
This section is from the book "Human Vitality And Efficiency Under Prolonged Restricted Diet", by Francis G.BENEDICT, Walter R. Miles, Paul Roth, And H. Monmouth Smith. Also available from Amazon: Human Vitality and Efficiency Under Prolonged Restricted Diet.
Transition Pulse. Part 2
The curves show the changes in the duration of the pulse cycles at the transition from standing to walking and also from walking to standing. X. transition point, standing-walking; Y. transition point, walking-standing. Duration of pulse cycle is given in 0.01". Each plotted point is the average of two cycles. The equivalent pulse-rate per minute is shown at the right. The elapsed time is given in seconds in smaller type at the bottom. The pulse-rates at the sixth, twelfth, and twenty-fourth minutes of walking are inserted between the two transition curves and indicate the pulse-rates as the walking progressed.
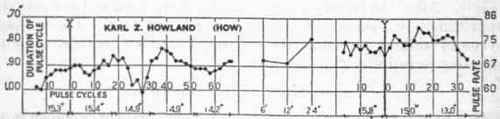
Fig. 95. - Transition pulse curves for Fisher, Hammond, Hartshorn, and Howland. Squad B, January 28, 1918.
The curve for Har (figure 95) is fragmentary, as certain portions of the time record of the photographic film were illegible and the first direct reading of the walking pulse comes approximately 4.5 seconds after the transition. This shows a change in the duration of the pulse cycle from 1.24 second at X to 0.84 second as the average of the fifth and sixth cycles. Between the tenth and twentieth cycles the records are missing, but the twentieth shows a slight lengthening, after which a shortening of the pulse cycle took place which reached its maximum at the forty-fourth cycle and was maintained with slight variations to the close of this part of the record. During the rest of the walking period, the pulse cycle lengthened somewhat, and by the time of the final transition was 0.84 second. When the subject stopped walking the cycles immediately began to lengthen and were 0.99 second at the end of the record.
Other members of the squad present similar pictures in the curves given in figures 96 and 97. In the case of Kim (figure 96) the duration was 0.79 second with the third and fourth cycles after walking began; a marked lengthening to 0.93 second appeared in the average of the fifth and sixth cycles. This was followed by a series of periods of changing length of the pulse cycles which appear to indicate a rhythm in the pulse. In the transition from walking to standing the first immediate lengthening was followed by a shortening of the cycles, so that the cycle is shorter from the tenth to the fourteenth cycles after walking ceased than during the walking period.
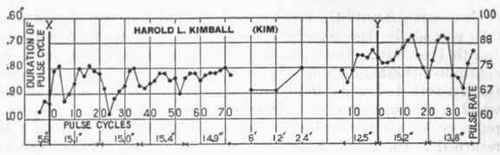
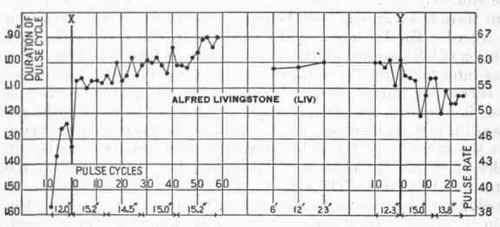
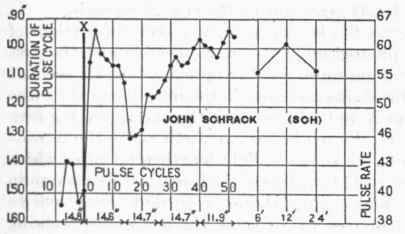
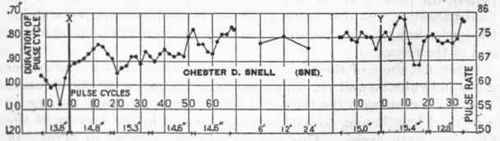
Fig. 96. - Tranaition pulse curves for Kimball, Livingstone, Schrack, and Snell, Squad B, January 28, 1918.
For detailed explanation, see figure 95.
Liv (figure 96) is the only subject whose pulse cycles do not show a marked lengthening in the duration following the first stimulus of walking. The sixth cycle lengthened slightly to 1.10 seconds, but the curve is in marked contrast to the others and with minor variations is that of a constantly shortening pulse cycle. The immediate lengthening of the cycle at the end of walking continued only through the eighth beat, when it was again followed by a marked shortening period for 6 cycles, after which it continued with an irregularly lengthening interval.
The curve for Tho (figure 97) is in the main like the others, but as only 29.7 seconds of the walking transition was secured, it is incomplete. An incipient lengthening of the cycle took place at the sixth beat, but the marked change did not occur until the fourteenth beat, when the duration changed from 0.96 to 1.13 seconds by the twenty-fourth cycle. At that point the quickening of the pulse apparently began, but the record here is incomplete. The pulse cycle was fairly uniform for the 9 cycles at the end of walking, with a duration of 1.18 seconds. This is approximately the duration of the original standing cycle. The cycle reached its maximum length of 1.39 seconds at the tenth beat, after which it shortened to 1.23 seconds at the twentieth beat.
The general picture which these figures for Squad B present is that of a rising curve - i. e., a shortening pulse cycle - beginning from 4 to 8 cycles before the transition to walking and continuing through the transition for a period rarely exceeding 12 cycles, and often not over 4 cycles. The curve then descends, reaching its maximum depression at or near the twentieth cycle, from which a second ascending curve begins.
At the final transition to standing less regularity is seen, but in general it may be said that the response by the heart is prompt, and the curve descends to a minimum at about the tenth cycle, after which there is a more or less pronounced rise, persisting for a few cycles, and then a tendency to fall slightly.
The initial rise while the subject was still standing before walking is accounted for from the routine of the experiment. Previous to the taking of the photographic record the subject had been standing quietly on the treadmill for some time. At a certain moment the assistant gave audible warning to the other assistants that he would start the mill in 15 seconds. This warning could be heard by the subject in the chamber, and a psychically stimulated pulse-rate followed in anticipation of the beginning of walking. The acceleration due to the anticipation of the starting of the treadmill makes it difficult to compare the pulse-cycle durations of the period of standing preliminary to walking with the pulse-cycle durations during walking. Some of the curves indicate that this psychological disturbance is partially or wholly overcome by the time the walking began, but the majority show that it extended into the walking period. To have given the subject no warning at all would have been equally disturbing for the surprise of the sudden starting of the treadmill would have given the pulse an undue stimulus which would not have been a part of the effort of walking.
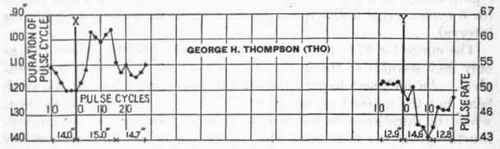
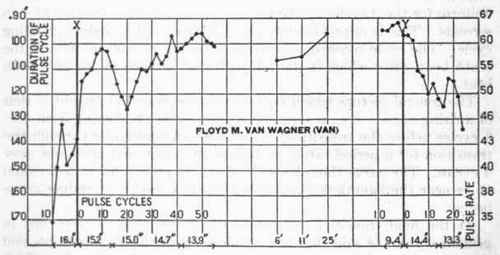
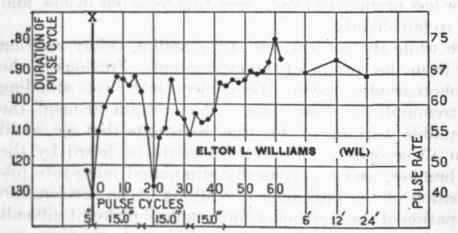
Fig. 97. - Transition pulse curves for Thompson, Van Wagner, and Williams, Squad B, January 28, 1918.
For detailed explanation, see figure 95.
Continue to:
My Books

